You have no items in your shopping cart.

How to Find and Fix Any Network Bottleneck
 Ehsan Ghasisin
How To
|
Expert Picks
08/07/2025 11:11am
7 minute read
High network latency, frustrating application timeouts, and constant user complaints are symptoms of a critical problem: a network bottleneck. These network performance issues demand a professional response. Guesswork and router reboots won't fix network congestion; you need a systematic, tool-based methodology to find the true root cause and resolve it permanently.
This guide delivers that methodology. It’s built for engineers who need to move from diagnosis to resolution with precision, tackling network slowdowns head-on.
You will learn exactly how to use professional tools to:
- Pinpoint saturation and errors with interface counters.
- Identify top talkers consuming your bandwidth using NetFlow & sFlow.
- Benchmark true link capacity with iPerf3 throughput testing.
- Trace hop-by-hop latency with MTR.
- Diagnose hidden issues like network oversubscription and firewall CPU utilization.
Step 1: What Is a Network Bottleneck & What Are the Symptoms?
A network bottleneck occurs when the demand for data on your network exceeds the available capacity of a specific link, device, or path. This choke point forces packets to be dropped or delayed, directly impacting bandwidth utilization and user experience.
Look for these classic symptoms of high network latency and congestion:
- Sluggish Applications: UIs feel slow, and transactions time out.
- Packet Loss & Retransmissions: Data is dropped, forcing TCP retransmissions that cripple performance.
- VoIP & Video Jitter: Real-time communications are choppy, and video conferences buffer.
- Slow File Transfers: Downloads and uploads take far longer than the link speed would suggest.
Step 2: How Do You Define the Problem Scope?
Before running a single command, you must narrow the field of investigation. A vague problem leads to wasted time.
Ask these four questions to localize the issue:
- What? Which specific applications are affected? (VoIP, a web app, file shares?)
- When? Does the problem occur at peak hours, randomly, or all day?
- Who? Is it impacting all users, a specific VLAN, or only remote staff?
- Where? Is the issue on the wired LAN, the wireless network, or across the WAN?
This initial triage focuses your efforts on the correct domain: the LAN, WAN, wireless infrastructure, security perimeter (firewall), or the application layer (e.g., DNS delays vs network issues).
Step 3: How Do You Check for Link Saturation & Errors?
Your first source of truth is the hardware itself. Router interface statistics expose hardware-level congestion that a simple ping test will never see. Check your core switches, routers, and firewalls for physical evidence of a struggle.
Cisco IOS/NX-OS Example:
show interfaces <interface_name> statsFortiGate Example:
diagnose hardware deviceinfo nic <interface_name>Focus on these metrics from your interface counters. An increase in any of them is a red flag.
- Input/Output Drops & Discards: The device is actively dropping packets because it can't keep up. This is the clearest sign of congestion.
- CRC or RX/TX Errors: Indicates physical layer problems like a bad cable, a failing optic, or a duplex mismatch.
- High Utilization: An uplink consistently near 100% utilization is a clear bottleneck.
Conclusion: High drop and error counts are undeniable proof of a saturated or faulty link. This is the first step in any serious latency troubleshooting process.
Step 4: How Do You Identify Network "Top Talkers"?
The fastest way to understand the source of congestion is to identify top talkers—the devices, users, or applications consuming the most bandwidth. The primary tools for this network traffic analysis are flow-based technologies.
- NetFlow (Cisco, FortiGate, MikroTik)
- sFlow (HP/Aruba, Extreme Networks)
- Network Analyzers like ntopng, SolarWinds NTA, or PRTG.
What's the Difference Between NetFlow and sFlow?
While both are effective, they work differently. NetFlow is stateful and tracks every IP conversation, providing granular detail ideal for deep packet loss diagnostics. sFlow is stateless and uses packet sampling, making it highly scalable for real-time monitoring in high-speed networks.
| Feature | NetFlow | sFlow |
| Method | Stateful Flow Export | Stateless Packet Sampling |
| Detail | Granular (per-session) | Statistical (sampled) |
| Overhead | Higher CPU/Memory | Lower CPU/Memory |
| Best For | Deep traffic analysis, security | High-speed networks, real-time visibility |
Step 5: How Do You Benchmark Real-World Throughput & Latency?
User reports of "slowness" are subjective. You need objective data to prove end-to-end connectivity performance. Use these tools to measure the raw network path and pinpoint exactly where delays occur.
Test Network Bandwidth with iPerf3
iPerf3 throughput testing proves whether the network path can deliver the required bandwidth, removing the application from the equation.
On the server host:
iperf3 -s
On the client host:
iperf3 -c server_ipAnalyze these key metrics:
- Throughput: The actual TCP/UDP bandwidth achieved.
- TCP Retransmissions: A clear sign of packet loss or congestion on the path.
- Jitter & Packet Loss: Essential for troubleshooting real-time protocols like VoIP (use iperf3 -u -b <bandwidth> for UDP tests).
Trace Latency with MTR
When comparing MTR vs traceroute, MTR is superior for diagnostics because it combines the functionality of both traceroute and ping in a single, continuous view. It traces the path hop-by-hop, revealing where latency and packet loss are introduced.
Look for two things in terms of the output:
- A sudden increase in latency that persists across all subsequent hops.
- Any single hop that shows consistent packet loss.
Step 6: How Do You Diagnose Hidden Bottlenecks?
Sometimes the problem isn't a single saturated link but a systemic issue. These are the most common hidden causes of network slowdowns.
Network Oversubscription (A Design Flaw)
This is one of the most common signs of oversubscription in a network switch: a 48-port access switch where all users are active, feeding into a single 1G uplink. During peak hours, that uplink chokes. This is a flaw in your oversubscription network design.
The Fix: This requires a hardware upgrade. Moving to 10G network switches or using link aggregation troubleshooting techniques like LACP are standard solutions.
Wireless Performance Issues
When you need to troubleshoot Wi-Fi performance issues, look beyond simple signal strength.
- Wi-Fi Backhaul Congestion: The AP's own wired uplink is at 100%.
- Access Point Channel Interference: Too many APs competing on the same channel.
The Fix: Often solved with better channel planning or upgrading to a modern Wi-Fi 6E access point to handle higher client density.
QoS or Firewall Policy Issues
A misconfigured QoS configuration issue or an overly restrictive firewall rule can create an artificial bottleneck, dropping legitimate packets under load.
Cisco Example:
show policy-map interface <interface_name>
This command reveals which traffic classes are being prioritized and, more importantly, which are experiencing drops.
Step 7: How to Tell if Your Firewall Is a Bottleneck
A bottleneck isn't always bandwidth. An overloaded router or firewall can become the chokepoint if its firewall CPU utilization is maxed out or it hits its firewall session limits.
FortiGate Example: get system performance topCisco Example: show processes cpu historyConclusion: A device with its CPU at 95% will drop packets and introduce latency, even if its links are only 50% utilized.
From Fixing to Preventing: Your Final Checklist
Resolving a bottleneck is reactive. Preventing the next one is strategic. Use this checklist for any network bottleneck troubleshooting scenario.
Step 1: Define the Scope. Isolate what, when, who, and where.
Step 2: Check Interface Counters. Look for drops, errors, and saturation. This is your ground truth.
Step 3: Identify Top Talkers. Use NetFlow or sFlow to see who is using the bandwidth.
Step 4: Test & Trace. Run iPerf3 to benchmark throughput and MTR to find latency.
Step 5: Investigate Hidden Causes. Check for oversubscription, device CPU limits, and policy issues.
Once you've used this methodology to identify the limiting hardware, you have the data to make an informed decision. Explore our selection of firewalls and multi-gigabit switches to build an infrastructure that eliminates bottlenecks—for good.
FAQs
1. How do you diagnose a network bottleneck?
Start by checking interface counters on switches and routers for drops or errors. Then, use NetFlow or sFlow to identify top talkers. Finally, run iPerf3 to test real throughput and MTR to trace hop-by-hop latency and packet loss.
2. What is the most common cause of high network latency?
The most common cause is network congestion, often due to oversubscription where an uplink (e.g., a 1G link) cannot handle the peak traffic from all connected devices. Hardware CPU exhaustion on a firewall or router is another common cause.
3. How can you tell if a firewall is causing a bottleneck?
Log into the firewall's CLI and check its CPU utilization and current session count. If the CPU is consistently above 80% during periods of slowness, or the session count is near the device's maximum limit, the firewall itself is the bottleneck.
Related Articles
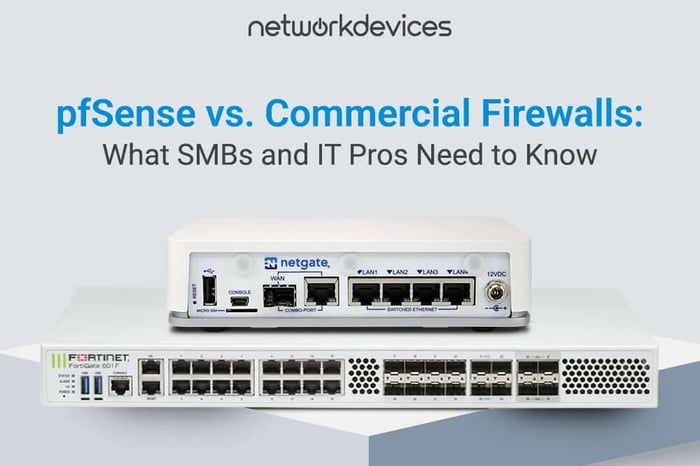
pfSense vs. Commercial Firewalls: What SMBs and IT Pros Need to Know
6 minute read
07/01/2025 11:31am
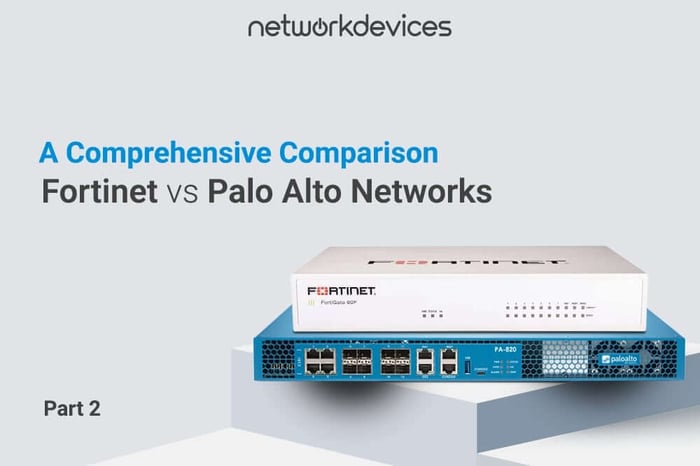
Fortinet vs Palo Alto: Best Enterprise Firewall in 2025
7 minute read
06/12/2025 10:18am
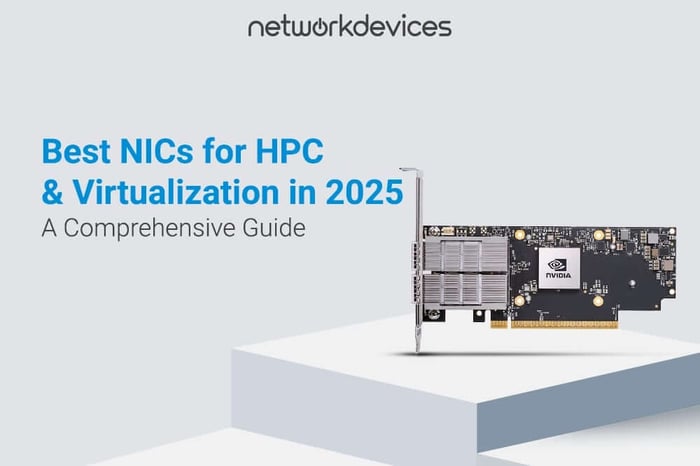
Best NICs for HPC & Virtualization in 2025
6 minute read
05/22/2025 11:23am


